As a Seasoned K8s Expert: An In-Depth Analysis of the OpenAI’s Incident and Mitigation Strategies
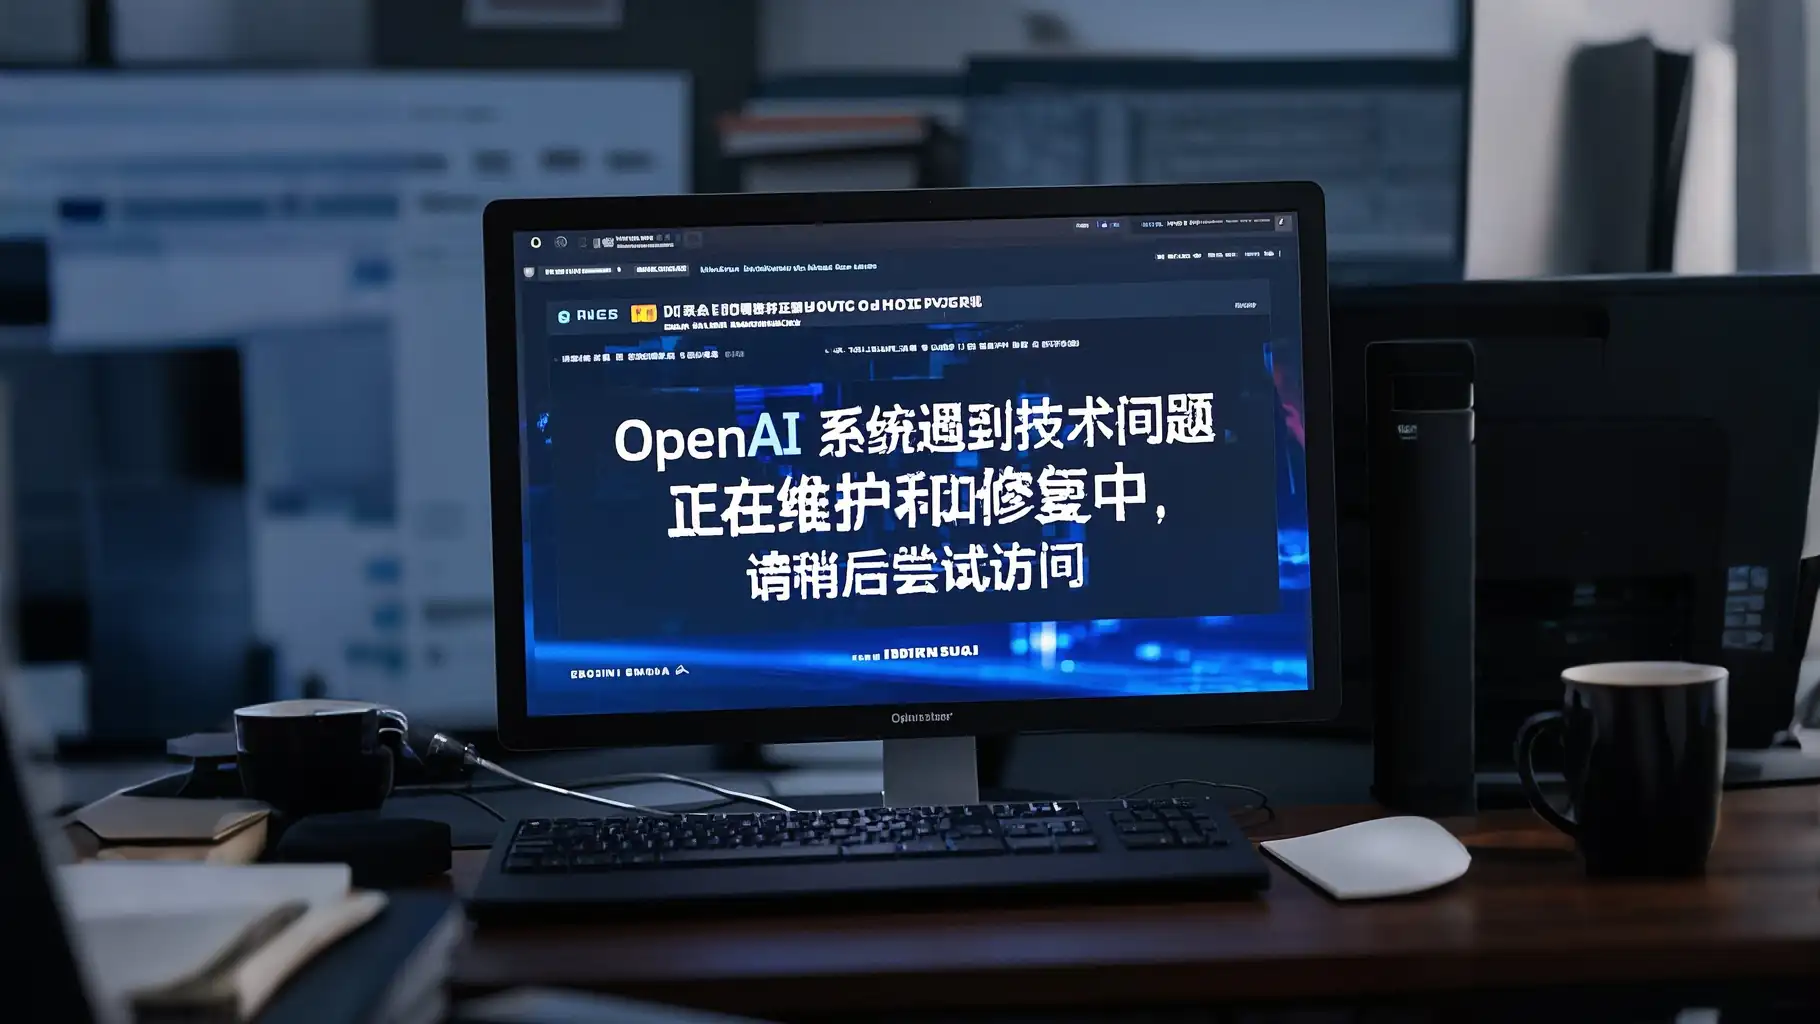
On December 11, 2024, OpenAI experienced a major outage caused by a failure in the Kubernetes cluster control plane. For outsiders, this may simply seem like an interesting incident, but as an insider, I analyzed this failure from a technical perspective.
After reviewing the incident report, I came up with three questions:
- What is the Telemetry service used for?
- What are the “expensive requests” mentioned in the report? Why would this program generate a high volume of resource-sensitive API requests?
- Why did it impact the business systems?
1 What is the Telemetry service used for?
The report mentions:
At 3:12 PM PST, we deployed a new telemetry service to collect detailed Kubernetes control plane metrics.
Telemetry services have a very wide footprint, so this new service’s configuration unintentionally caused every node in each cluster to execute resource-intensive Kubernetes API operations whose cost scaled with the size of the cluster. With thousands of nodes performing these operations simultaneously, the Kubernetes API servers became overwhelmed, taking down the Kubernetes control plane in most of our large clusters.
From this, we can extract the following key points:
- The Telemetry service was intended to collect metrics from the Kubernetes control plane.
- The service’s configuration accidentally caused every node to execute “expensive requests.”
- As thousands of nodes simultaneously issued these requests, the Kubernetes API servers were overwhelmed, leading to the control plane’s collapse.
Based on this, I infer that the control plane includes not only the API server, controller manager, and scheduler but also kubelet. The Telemetry service likely collects metrics from the kubelet on each node.
There are two possible deployment methods for the Telemetry service:
- Push mode: Each node runs an agent to collect metrics and push them to a central service.
- Pull mode: A central service periodically pulls metrics from the kubelet on each node.
Given OpenAI’s [article about scaling Kubernetes clusters to 7,500 nodes](https://openai.com/index/scaling-kubernetes-to-7500-nodes/#:~:text=We try to avoid having any DaemonSets interact with the API Server.), which mentions, “We try to avoid having any DaemonSets interact with the API Server,” I speculate that they used the second option, the pull mode.
2 What are the “expensive requests”?
In Kubernetes, “expensive requests” often refer to list operations, as they consume significant memory. If the data is not in the watch cache, the load on etcd increases.
However, from the architecture perspective, it’s unlikely that each node would run a pod to issue these list requests.
So, what type of requests are they?
My answer: Authentication and authorization requests. Considering OpenAI’s stringent security requirements, kubelet likely disables anonymous access (--anonymous-auth=false) and enables authentication and authorization (--authentication-token-webhook and --authorization-mode=Webhook).
Specifically, when kubelet receives a request to access its endpoints (e.g., /metrics/*, /stats/*, /logs/*), it sends TokenReview and SubjectAccessReview requests to the API Server to perform authentication and authorization.
Typically, the API server enables multiple authentication methods, such as RequestHeader, Basic auth, x509, static token, service account token, bootstrap token, OIDC, webhook, or Anonymous. If OIDC or webhook is enabled, additional third-party systems are involved, extending the chain.
Kubelet also caches authorization results with --authorization-webhook-cache-authorized-ttl and --authorization-webhook-cache-unauthorized-ttl. However, during the first request, there would be no cache.
As the Telemetry service fetches metrics from many nodes simultaneously, it triggers kubelet to send a large number of authentication and authorization requests to the API Server.
3 Why did it impact business systems?
In Kubernetes, even if the API server crashes, other control plane components (controller-manager, scheduler) and data plane components (kubelet, kube-proxy, pods) continue running. Containers won’t restart. As long as business systems don’t rely on Kubernetes services (e.g., service DNS names), they shouldn’t be affected. Even ingress controllers generally maintain high robustness.
However, OpenAI’s business appears to rely on Kubernetes’ service discovery, specifically internal DNS for resolving service names.
The report states:
The impact was specific to clusters exceeding a certain size, and our DNS cache on each node delayed visible failures long enough for the rollout to continue.
…
DNS caching mitigated the impact temporarily by providing stale but functional DNS records. However, as cached records expired over the following 20 minutes, services began failing due to their reliance on real-time DNS resolution.
This suggests OpenAI used a combination of NodeLocal DNS and CoreDNS, where NodeLocal DNS serves as a local cache with a TTL of 20 minutes.

Here’s how it works:
- If the requested domain is in the NodeLocal DNS cache, the cache returns the result.
- If not, NodeLocal DNS queries CoreDNS, which resolves the domain to either a ClusterIP or the IPs of all endpoints.
When the API server crashes, it impacts the informer’s data updates (e.g., service and endpoint changes). However, CoreDNS can still resolve DNS queries using stale data.
3.1 Skepticism about the DNS explanation in the report
The report states:
DNS caching mitigated the impact temporarily by providing stale but functional DNS records. However, as cached records expired over the following 20 minutes, services began failing due to their reliance on real-time DNS resolution. This timing was critical because it delayed the visibility of the issue, allowing the rollout to continue before the full scope of the problem was understood. Once the DNS caches were empty, the load on the DNS servers was multiplied, adding further load to the control plane and further complicating immediate mitigation.
I question this explanation: If services rely on real-time resolution, why enable DNS caching at all?
DNS issues would only interrupt business operations in two scenarios:
- Rolling out or scaling existing services: Changes in service endpoints or EndpointSlices may render CoreDNS results outdated.
- Deploying new services: If CoreDNS cannot resolve the new domain, other services will fail to communicate with it.
Thus, DNS caching seems like a contributing factor rather than the root cause. The core issue likely lies in architectural design, with DNS being an incidental scapegoat.
4 How to handle the incident
When the API server is down, cluster components and clients often use exponential backoff algorithms to retry connections, exacerbating the server’s load.
Removing Telemetry service pods at this point is futile since they can’t connect to the API server. Even if they could, the controller manager and kubelet would also need to connect successfully to execute the removal.
OpenAI’s emergency actions included:
- Reducing cluster size: To lower request pressure.
- Blocking client access at the network layer: To prevent unnecessary API server requests.
- Scaling up the API server: To improve its capacity.
The goal was to reduce the API server’s load, allowing it to recover and reconnect with clients and components without being overwhelmed again.
5 How to prevent similar incidents? Improvement Measures
The main idea is to avoid over-coupling the underlying platform with business systems, avoid relying on Kubernetes’ service discovery mechanisms, and refrain from using ConfigMap as a configuration center for microservices.
The following suggestions are based on Kubernetes v1.30.
5.1 Client Side
Use the latest version of client-go: The community continuously optimizes the reflector, and adopting a newer version can effectively reduce pressure.
Limit the concurrency of client requests to the API server: Set appropriate values for --kube-api-burst and --kube-api-qps for cluster components and configure reasonable qps and burst values for all clients developed using client-go.
5.2 API Server
Separate API servers: Create dedicated API servers for use by cluster components and for management and maintenance (including deployment systems). This ensures that management operations can still proceed when the cluster encounters issues.
Enable API Priority and Fairness (APF): API Priority and Fairness schedules requests based on priority and fairness. This feature is enabled by default.
Configure reasonable
PriorityLevelConfigurationandFlowSchemato ensure that under high system pressure, critical requests are not overwhelmed by less important ones, allowing them to be processed by the API server.Set a reasonable maximum number of concurrent requests: When APF is enabled, the API server’s maximum concurrency is determined by the sum of
--max-requests-inflight(default 400) and--max-mutating-requests-inflight(default 200).Use a separate etcd instance for storing events: For example,
--etcd-servers-overrides=/events#http://172.18.0.2:14379.Configure an appropriate watch cache size: The watch cache (
--watch-cache-sizesand--default-watch-cache-size) is used by the API server to cache data from etcd. If it’s too small, list requests will read directly from etcd, and if it’s too large, it will consume excessive memory.CautionAfter version 1.25, –watch-cache-sizes sets a non-zero value to enable the watch cache for such resources and watch size can’t be change (use the default size), and 0 to disable the watch cache. https://github.com/kubernetes/kubernetes/pull/109201
Enable
goaway-chance: When clients access the API server through a load balancer, ensure long connections to multiple API servers are balanced. If clients use HTTP/2 long connections without disconnection, this can result in uneven connections and load among API servers. Enabling this parameter allows the API server to randomly send HTTP/2 clients a GOAWAY frame, prompting the client to disconnect and re-establish a connection. The load balancer can then randomly select an API server, ultimately balancing the long connections across multiple servers.
5.3 Ongoing Optimizations in the Community
- Introduction of WatchList in v1.31 and v1.32: WatchList enables list requests to use streams for transmission, significantly improving efficiency and reducing memory usage. Its goal is to replace the list-watch mechanism in the reflector.
- Resilient watch cache initialization in v1.31: Resilient watch cache initialization addresses scenarios where the watch cache is not initialized during the API server startup or requires reinitialization.
With years of expertise in Kubernetes, I offer consultations for troubleshooting, source code interpretation, and answering Kubernetes-related questions. Click here to contact me.