Why Is HPA Scaling Slow
Recently, during a surge in business activity, we encountered a problem where the availability of our services decreased due to a sudden increase in resource usage caused by incoming traffic. There are various reasons for the unavailability of our services, and one of the direct causes is the sharp increase in resource usage when traffic surges, and the HPA does not scale in a timely manner.
This article aims to investigate this issue and primarily addresses it from three aspects:
- How slow is the scaling process?
- Why is the scaling process slow?
- What are the solutions to this problem?
1 How Slow Is the Scaling Process
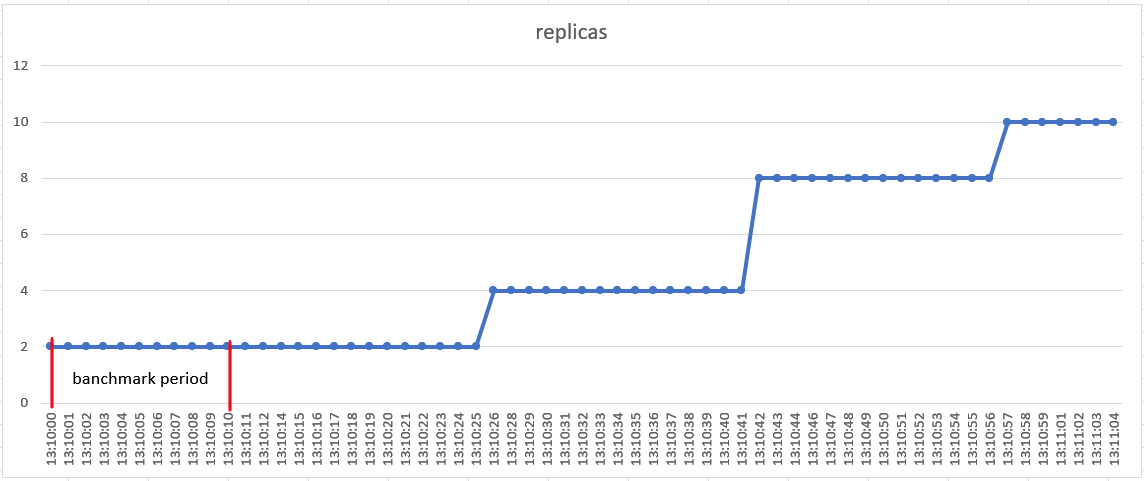
To illustrate how slow the scaling process is, we conducted HPA scaling tests, recording the number of replicas and resource usage of pods at each moment. We compared the time when traffic increased and the time when the number of replicas first increased to approximate the scaling delay.
HPA’s data source configurations include “Object,” “Pods,” “Resource,” “ContainerResource,” and “External.” For simplicity, we used “Resource” for testing, and the Kubernetes version was 1.23.
Testing method: We prepared an Nginx deployment and service, then performed load testing on this service, recording the number of replicas at each moment.
The Nginx deployment has 2 replicas, with a CPU request of 20m, and the HPA’s target is set at 20% average utilization of the request.
apiVersion: apps/v1
kind: Deployment
metadata:
  name: nginx-deployment
  namespace: default
spec:
  replicas: 2
  selector:
    matchLabels:
      app: nginx
  template:
    metadata:
      creationTimestamp: null
      labels:
        app: nginx
    spec:
      containers:
      - image: nginx:1.18
        imagePullPolicy: IfNotPresent
        name: nginx
        ports:
        - containerPort: 80
          protocol: TCP
        resources:
          requests:
            cpu: 20m
---
apiVersion: autoscaling/v2
kind: HorizontalPodAutoscaler
metadata:
  name: nginx-deployment
  namespace: default
spec:
  maxReplicas: 10
  metrics:
  - resource:
      name: cpu
      target:
        averageUtilization: 20
        type: Utilization
    type: Resource
  minReplicas: 2
  scaleTargetRef:
    apiVersion: apps/v1
    kind: Deployment
    name: nginx-deployment
---
apiVersion: v1
kind: Service
metadata:
  labels:
    app: nginx
  name: ngx-service
  namespace: default
spec:
  clusterIP: 10.252.211.253
  clusterIPs:
  - 10.252.211.253
  externalTrafficPolicy: Cluster
  internalTrafficPolicy: Cluster
  ipFamilies:
  - IPv4
  ipFamilyPolicy: SingleStack
  ports:
  - port: 80
    protocol: TCP
    targetPort: 80
  selector:
    app: nginx
  sessionAffinity: None
  type: ClusterIP
1.1 Testing Process
We used the ab command to perform load testing on the cluster IP:
# date;ab -n 100000 -c 20 10.252.211.253/;date
Thu Nov  2 13:10:00 CST 2023
.....
Thu Nov  2 13:10:11 CST 2023
In another terminal, we recorded pod metrics:
while :; do date; kubectl get pods.metrics.k8s.io  -l app=nginx; echo; sleep 1; done

Thu Nov  2 13:10:23 CST 2023
NAME                                CPU   MEMORY   WINDOW
nginx-deployment-596d9ffddd-6lrhv   0     9604Ki   17.068s
nginx-deployment-596d9ffddd-w6cm2   0     2060Ki   17.634s

Thu Nov  2 13:10:25 CST 2023
NAME                                CPU          MEMORY   WINDOW
nginx-deployment-596d9ffddd-6lrhv   505634152n   9548Ki   13.763s
nginx-deployment-596d9ffddd-w6cm2   523202787n   2060Ki   13.914s

Thu Nov  2 13:10:27 CST 2023
NAME                                CPU          MEMORY   WINDOW
nginx-deployment-596d9ffddd-6lrhv   505634152n   9548Ki   13.763s
nginx-deployment-596d9ffddd-w6cm2   523202787n   2060Ki   13.914s
In another terminal, we recorded the number of replicas:
# while :; do date; kubectl get deployments.apps nginx-deployment; sleep 1; echo; doneIn another terminal, we recorded HPA resource changes:
kubectl get hpa nginx-deployment -o yaml -wThe complete test records are available at https://gist.github.com/wu0407/ebea8c0ee9ecbc15e94b3122f1a193dc.
1.2 Test Results
- Load testing started at 13:10:00 and ended at 13:10:11.
- At 13:10:26, 2 replicas were scaled up. At 13:10:42, 4 replicas were scaled up. At 13:10:57, 2 replicas were scaled up.
- At 13:10:25, pod metrics showed an increase in resource usage.
1.3 Results Analysis
Since the scaling threshold for pods is an average CPU usage of 4m, it can be roughly assumed that as long as there are requests, the average CPU usage of pods exceeds 4.2m (an additional --horizontal-pod-autoscaler-tolerance needs to be added, which defaults to 0.1). Therefore, the scaling delay in this experiment is approximately 26 seconds.
Scaling occurs in three stages, not all at once scaling to 10 replicas.
Even when there is no load testing traffic, scaling occurs. The currentMetrics in the HPA object shows resource usage as 0, but desiredReplicas and currentReplicas are not equal.
currentMetrics:
  - resource:
      current:
        averageUtilization: 0
        averageValue: "0"
      name: cpu
    type: Resource
  currentReplicas: 8
  desiredReplicas: 10
  lastScaleTime: "2023-11-02T05:10:57Z"
2 Why is Scaling Slow
Why does the scaling behavior described above occur, and what causes the scaling delay?
To answer these questions, we first need to understand the scaling mechanism and scaling algorithm of HPA (Horizontal Pod Autoscaler).
2.1 HPA Scaling Mechanism
The horizontal pod autoscaler controller is part of kube-controller-manager. It accesses various types of resource monitoring data by communicating with the API server. These monitoring data are provided by metrics-server, an Aggregated API Server that extends the metrics.k8s.io group. The custom.metrics.k8s.io and external.metrics.k8s.io group APIs are provided by the prometheus-adapter as Aggregated API Servers.
Here is an architecture diagram of HPA:
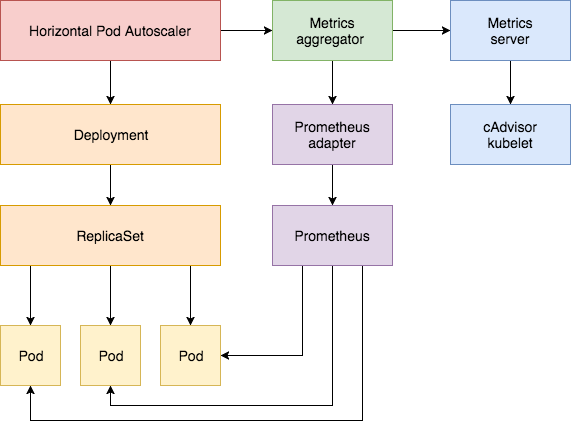
Image source: Weave Works Blog
2.2 HPA Calculation Process
The horizontal pod autoscaler controller by default performs an HPA object tuning every 15 seconds, meaning it calculates the desired number of replicas based on monitoring data every 15 seconds. If the desired number of replicas is not equal to the current number of replicas, scaling (up or down) is initiated.
The process involves the following steps:
- Access the API server to obtain monitoring data.
- Calculate the desired number of replicas.
- Control the scaling behavior.
2.2.1 Obtaining Monitoring Data
Different types of data sources access different addresses to retrieve monitoring data. The specifics can be found in the HPA code annotations.
2.2.2 Replicas Algorithm
The following variables are used in the replicas calculation:
- ratio: The current metric value relative to the target value.
- tolerance: The
--horizontal-pod-autoscaler-toleranceparameter, which specifies the range for tolerance during scaling and has a default value of 0.1. - Replicas: The number of replicas specified in the workload’s scale resource’s spec.replicas.
- Current Replicas: The current number of replicas in the scale resource’s status.replicas.
- Desired Replicas: The desired number of replicas.
2.2.2.1 Object-Type Data Sources
- If the target type is “Value,” then
ratio = MetricValue / spec.metrics[*].object.target.value.- If
spec.replicasis 0,desiredReplicasis rounded up toratio. - If
spec.replicasis greater than 0, andratiois within the range[1-tolerance, 1+tolerance], no scaling is performed, anddesiredReplicasremains atspec.replicas. Otherwise,desiredReplicasis rounded up toratio * readyPodCount.
- If
- If the target type is “AverageValue,” then
ratio = MetricValue / (spec.metrics[*].object.target.averageValue * status.replicas).- If
ratiois within the range[1-tolerance, 1+tolerance], no scaling is performed, anddesiredReplicasremains atspec.replicas. - Otherwise,
desiredReplicasis calculated asMetricValue / spec.metrics[*].object.target.averageValue, rounded up.
- If
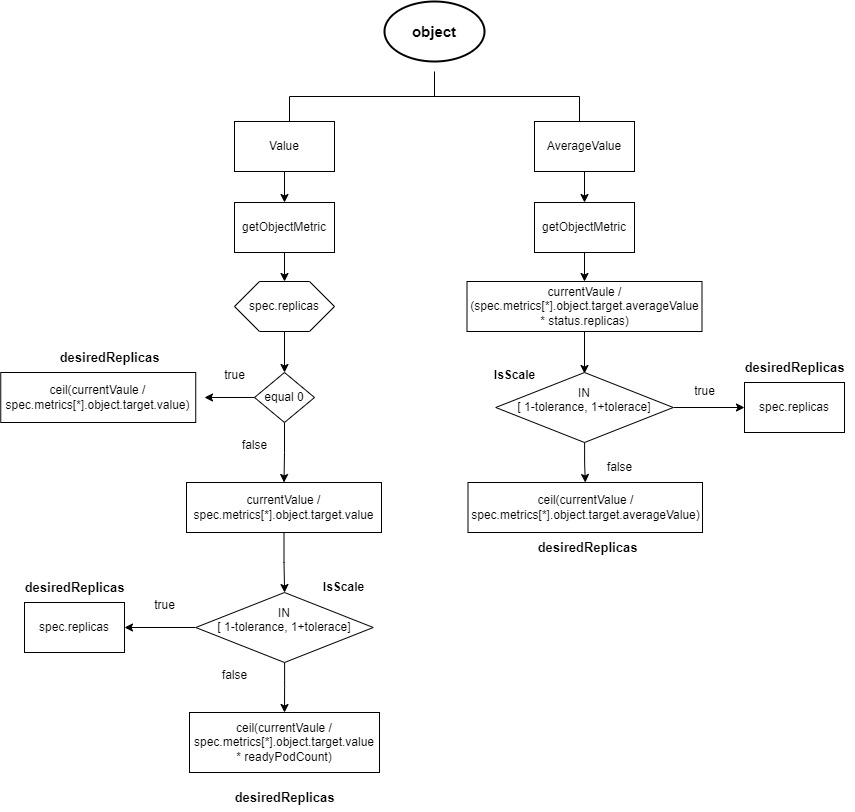
Here, readyPodCount refers to the number of pods in a ready state.
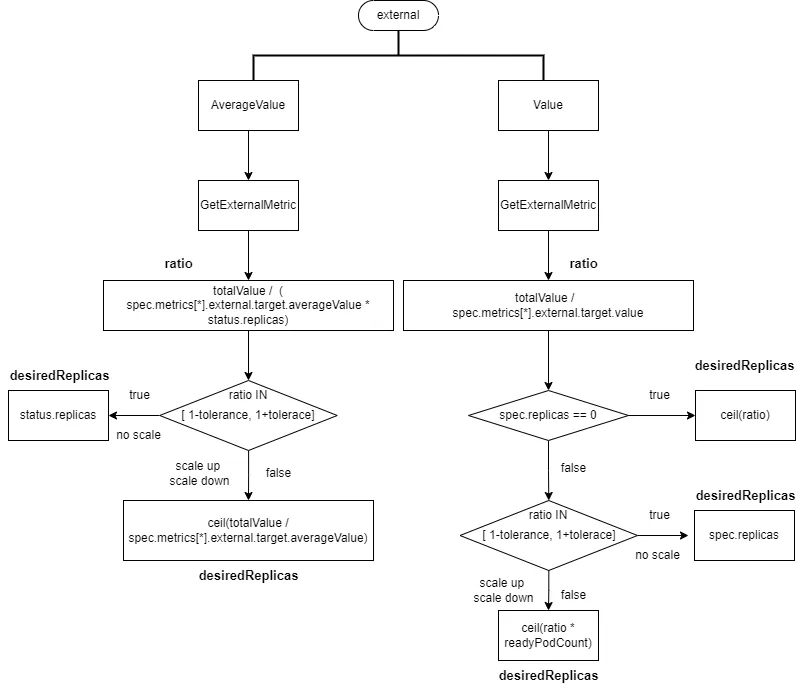
2.2.2.2 External-Type Data Sources
- If the target type is “Value,” then
ratio = totalValue / spec.metrics[*].external.target.value.- If
spec.replicasis 0,desiredReplicasis rounded up toratio. - If
spec.replicasis greater than 0, andratiois within the range[1-tolerance, 1+tolerance], no scaling is performed, anddesiredReplicasremains atspec.replicas. Otherwise,desiredReplicasis rounded up toratio * readyPodCount.
- If
- If the target type is “AverageValue,” then
ratio = totalValue / (spec.metrics[*].external.target.averageValue * status.replicas).- If
ratiois within the range[1-tolerance, 1+tolerance], no scaling is performed, anddesiredReplicasremains atstatus.replicas. - Otherwise,
desiredReplicasis calculated astotalValue / spec.metrics[*].external.target.averageValue, rounded up.
- If
2.2.2.3 Pod Categorization
Pod categorization is necessary because the status of pods and the presence of monitoring data affect the calculation of replica numbers. Pods are classified into different categories based on their status and monitoring data.
cpuInitializationPeriod: The value of --horizontal-pod-autoscaler-cpu-initialization-period, which is set to 5 minutes by default.
delayOfInitialReadinessStatus: The value of --horizontal-pod-autoscaler-initial-readiness-delay, set to 30 seconds by default.
Pods are categorized based on their status and monitoring data into four groups: “Ready with Monitoring Data,” “Unready Pods,” “Ignored Pods,” and “Missing Pods.”
Unready Pods:
- Pods with a Phase of “Pending.”
- Data sources of type “resource” or “containerResource” for CPU resource monitoring.
- Pods with no “Ready” condition in their status or a
pod.Status.StartTimevalue of nil (indicating the pod hasn’t been taken over by the kubelet). - If the calculated replica time hasn’t exceeded the pod’s startup time plus
cpuInitializationPeriodand the ready condition is false. - If the pod is in a ready state, but the metric’s timestamp is before
readyCondition.LastTransitionTimeplusmetric.Window. - If the calculated replica time has exceeded the pod’s startup time plus
cpuInitializationPeriod, the ready condition is false, andreadyCondition.LastTransitionTimeis within the time period defined bypod.Status.StartTimeplusdelayOfInitialReadinessStatus.
- Pods with no “Ready” condition in their status or a
Missing Pods: Pods that lack monitoring data.
Ignored Pods: Pods that have been deleted or have a Phase of “Failed.”
2.2.2.4 Data Correction
The two types (External-Type and Object-Type) of monitoring data mentioned above are aggregate data, meaning multiple pods correspond to a single set of monitoring data. The next three types (Pods and Resource and Container Resource) of monitoring data are not aggregated; each pod has its monitoring data. Pod anomalies and missing monitoring data can lead to inaccurate replica calculations. To avoid excessive scaling up and down, data correction is performed as follows:
- Calculate the desired number of replicas based on the number of ready pods and existing monitoring data. Determine whether scaling up or down is needed without considering tolerance.
- For scaling up, correct the monitoring data for pods without monitoring data to 0.
- For scaling down, correct the monitoring data for pods without monitoring data to the target value set in the HPA object.
- If scaling up is required and there are unready pods, correct the monitoring data for unready pods to 0. This is done to prevent new pods with high CPU usage during startup from triggering continuous scaling.
- The following table summarizes actions to take based on the presence of unready pods and missing pods:
| unreadyPods > 0 | missingPods > 0 | action | |
|---|---|---|---|
| Scale Up | true | true | Fix unreadyPods and missingPods metrics value as 0 |
| Scale Up | true | false | No action |
| Scale Up | false | true | Fix missingPods metrics value as 0 |
| Scale Up | false | false | No action |
| Scale Down | true | true | Fix missingPods metrics as the target value |
| Scale Down | true | false | No action |
| Scale Down | false | true | Fix missingPods metrics as the target value |
| Scale Down | false | false | No action |
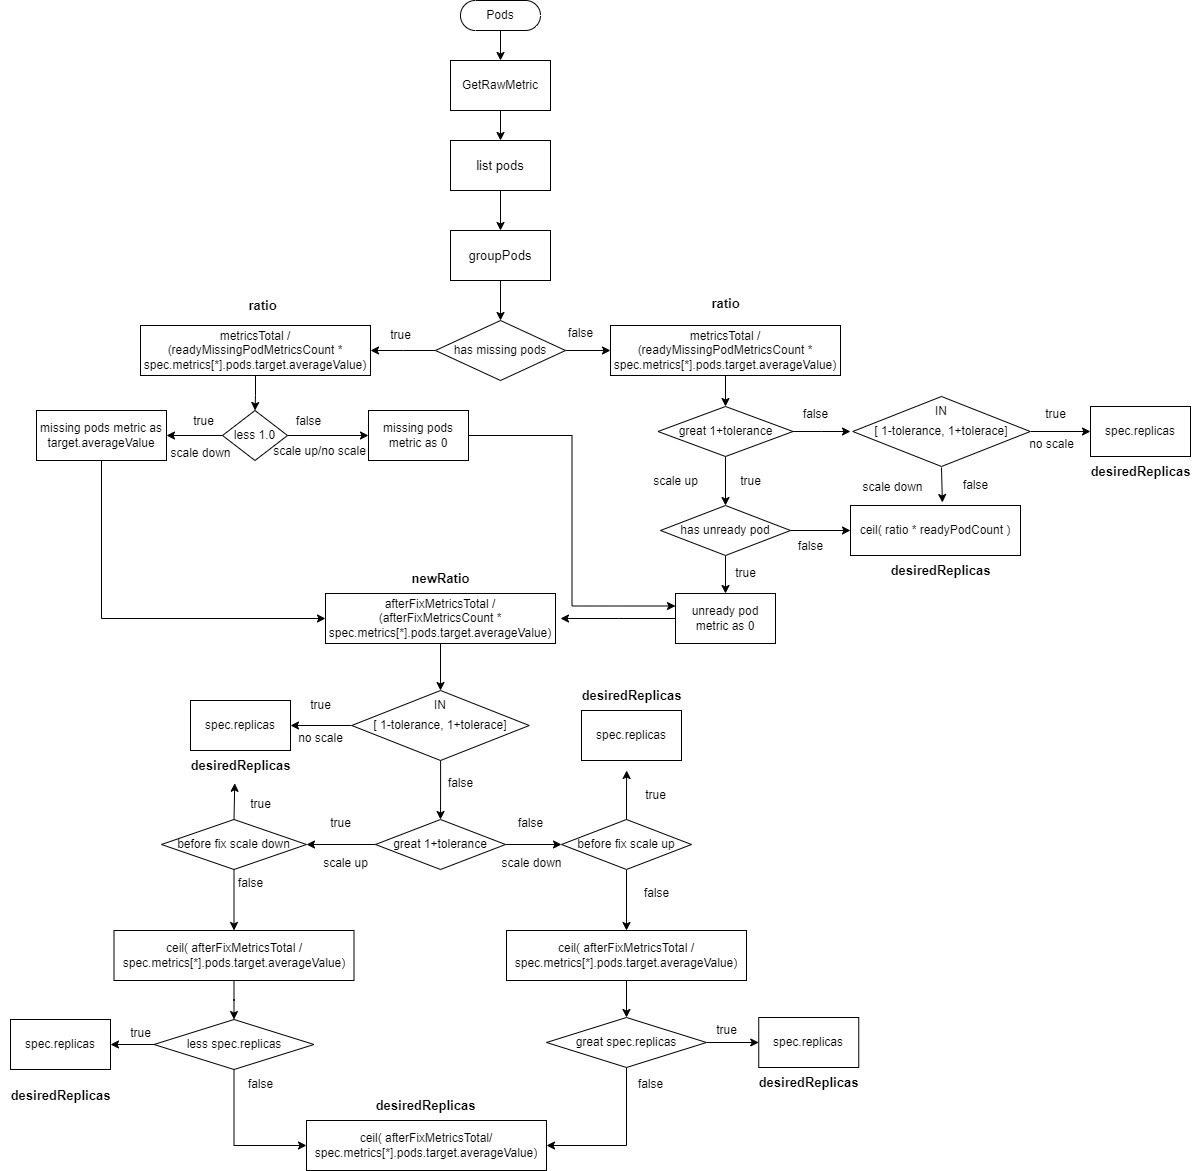
2.2.2.5 Pods-Type Data Sources
readyMissingPodMetricsCountis the count of pod metrics after removingignoredPodsandunreadyPods.afterFixMetricsCountis the count of pod metrics after data correction.
- Calculate
ratio = metricsTotal / (readyMissingPodMetricsCount * spec.metrics[*].pods.target.averageValue). - If there are
missingPodsandratiois less than 1 (scaling down), correct the monitoring data formissingPodstospec.metrics[*].pods.target.averageValue, and includemissingPodsinafterFixMetricsCount. - If there are
missingPodsandratiois greater than or equal to 1 (scaling up or no change), correct the monitoring data formissingPodsto 0 and includemissingPodsinafterFixMetricsCount. If there areunreadyPods, correct their monitoring data to 0 and includeunreadyPodsinafterFixMetricsCount. - If there are no
missingPodsandratiois greater than1+tolerance(scaling up) andunreadyPodsexist, correct the monitoring data forunreadyPodsto 0, and includemissingPodsinafterFixMetricsCount. - If there are no
missingPodsandratiois greater than1+tolerance(scaling up) andunreadyPodsdo not exist, thedesiredReplicasis calculated asratio * readyPodCount, rounded up. - If there are no
missingPodsandratiois within the range[1-tolerance, 1+tolerance], no scaling is performed, and thedesiredReplicasremains atspec.replicas. - If there are no
missingPodsandratiois less than1-tolerance(scaling down), thedesiredReplicasis calculated asratio * readyPodCount, rounded up. - Recalculate the new ratio:
newRatio = afterFixMetricsTotal / (afterFixMetricsCount * spec.metrics[*].pods.target.averageValue. - If the new ratio is within the range
[1-tolerance, 1+tolerance], no scaling is performed, and thedesiredReplicasremains atspec.replicas. - If the new ratio is greater than
1+toleranceand the previous ratio was less than1-tolerance(scaling down followed by scaling up), no scaling is performed, and thedesiredReplicasremains atspec.replicas. - If the new ratio is less than
1-toleranceand the previous ratio was greater than1+tolerance(scaling up followed by scaling down), no scaling is performed, and thedesiredReplicasremains atspec.replicas. - Calculate the new number of replicas as
ceil(afterFixMetricsTotal / spec.metrics[*].pods.target.averageValue). - If the new ratio is greater than
1+toleranceand the previous ratio was also greater than1+tolerance(scaling up followed by scaling up), and the new number of replicas is less thanspec.replicas, no scaling is performed, and thedesiredReplicasremains atspec.replicas. - If the new ratio is less than
1-toleranceand the previous ratio was also less than1-tolerance(scaling down followed by scaling down), and the new number of replicas is greater thanspec.replicas, no scaling is performed, and thedesiredReplicasremains atspec.replicas. - In all other cases, the
desiredReplicasis set toceil(afterFixMetricsTotal / spec.metrics[*].pods.target.averageValue)rounded up.
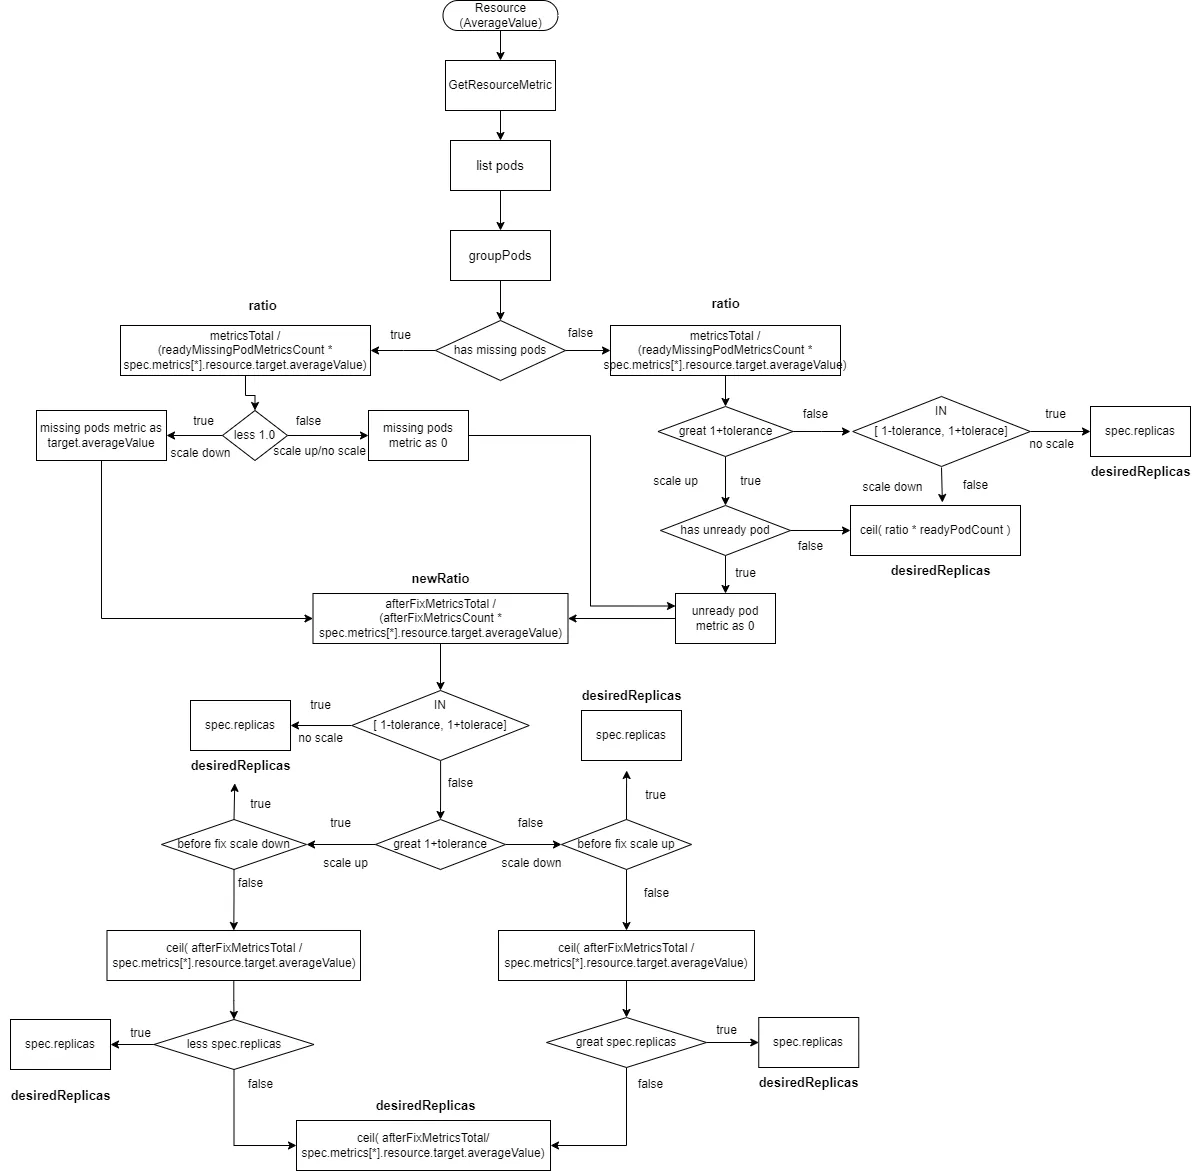
2.2.2.6 Resource-Type Data Sources with an “AverageValue” Type
This process is similar to “Pods-Type” but with a different method for obtaining metric data, and the target value is spec.metrics[*].resource.target.averageValue.
readyMissingPodMetricsCountis the count of pod metrics after removingignoredPodsandunreadyPods.afterFixMetricsCountis the count of pod metrics after data correction.
- Calculate
ratio = metricsTotal / (readyMissingPodMetricsCount * spec.metrics[*].resource.target.averageValue). - If there are
missingPodsandratiois less than 1 (scaling down), correct the monitoring data formissingPodstospec.metrics[*].resource.target.averageValue, and includemissingPodsinafterFixMetricsCount. - If there are
missingPodsandratiois greater than or equal to 1 (scaling up or no change), correct the monitoring data formissingPodsto 0, and includemissingPodsinafterFixMetricsCount. If there areunreadyPods, correct their monitoring data to 0, and includeunreadyPodsinafterFixMetricsCount. - If there are no
missingPodsandratiois greater than1+tolerance(scaling up) andunreadyPodsexist, correct the monitoring data forunreadyPodsto 0, and includemissingPodsinafterFixMetricsCount. - If there are no
missingPodsandratiois greater than1+tolerance(scaling up) andunreadyPodsdo not exist, thedesiredReplicasis calculated asratio * readyPodCount, rounded up. - If there are no
missingPodsandratiois within the range[1-tolerance, 1+tolerance], no scaling is performed, and thedesiredReplicasremains atspec.replicas. - If there are no
missingPodsandratiois less than1-tolerance(scaling down), thedesiredReplicasis calculated asratio * readyPodCount, rounded up. - Recalculate the new ratio:
newRatio = afterFixMetricsTotal / (afterFixMetricsCount * spec.metrics[*].resource.target.averageValue. - If the new ratio is within the range
[1-tolerance, 1+tolerance], no scaling is performed, and thedesiredReplicasremains atspec.replicas. - If the new ratio is greater than
1+toleranceand the previous ratio was less than1-tolerance(scaling down followed by scaling up), no scaling is performed, and thedesiredReplicasremains atspec.replicas. - If the new ratio is less than
1-toleranceand the previous ratio was greater than1+tolerance(scaling up followed by scaling down), no scaling is performed, and thedesiredReplicasremains atspec.replicas. - Calculate the new number of replicas as
ceil(afterFixMetricsTotal / spec.metrics[*].resource.target.averageValue). - If the new ratio is greater than
1+toleranceand the previous ratio was also greater than1+tolerance(scaling up followed by scaling up), and the new number of replicas is less thanspec.replicas, no scaling is performed, and thedesiredReplicasremains atspec.replicas. - If the new ratio is less than
1-toleranceand the previous ratio was also less than1-tolerance(scaling down followed by scaling down), and the new number of replicas is greater thanspec.replicas, no scaling is performed, and thedesiredReplicasremains atspec.replicas. - In all other cases, the
desiredReplicasis set toceil(afterFixMetricsTotal / spec.metrics[*].resource.target.averageValue)rounded up.
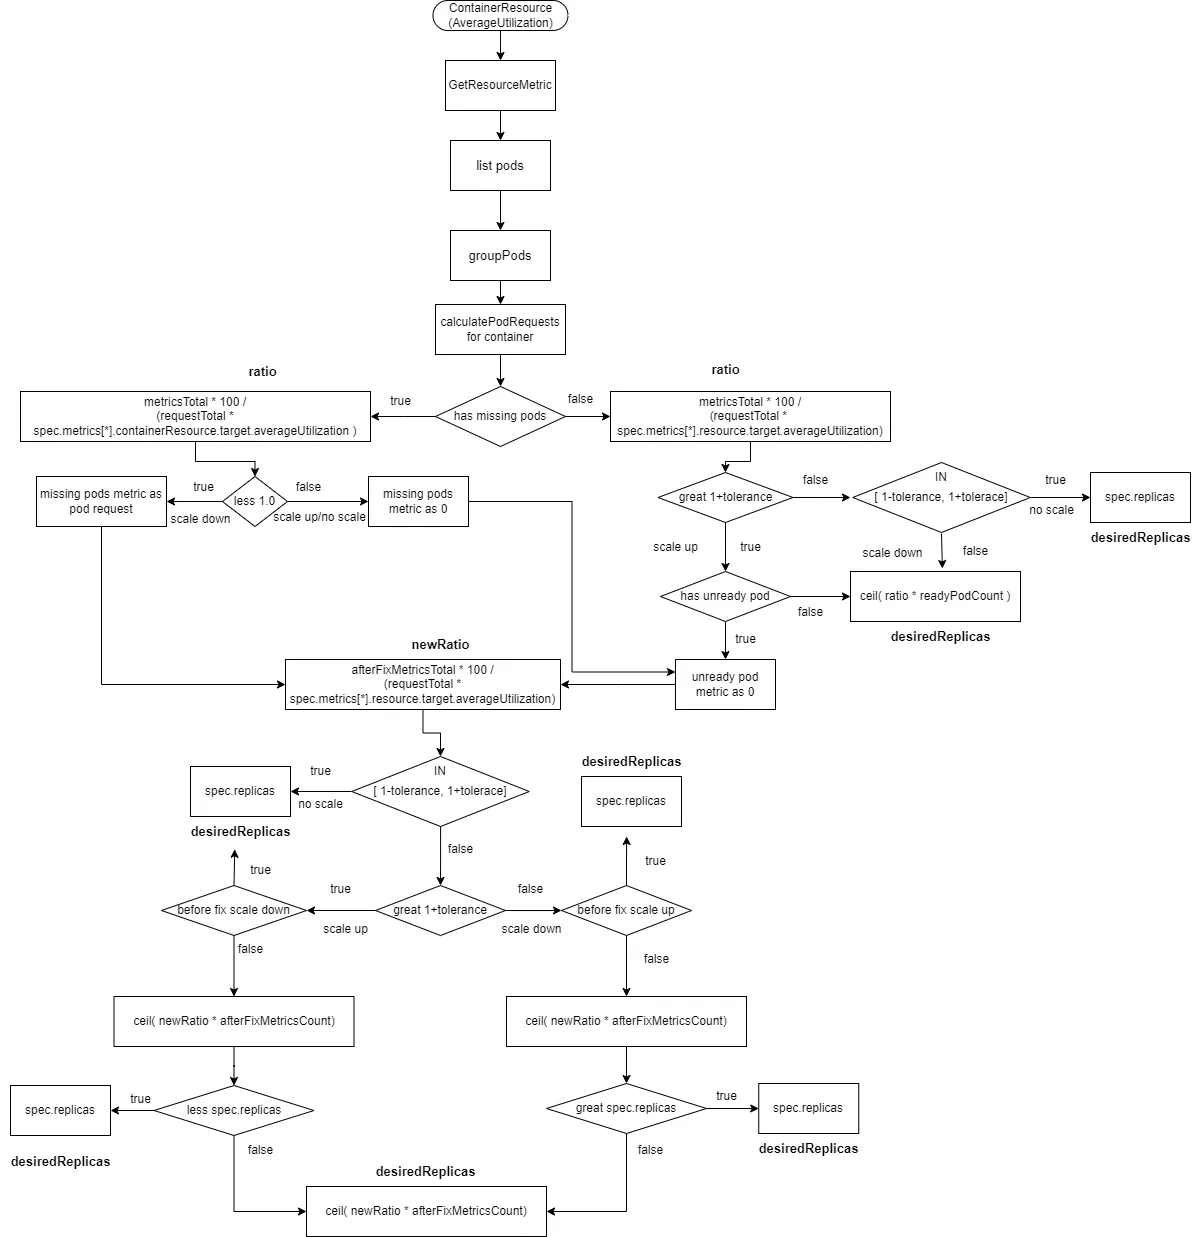
2.2.2.7 Resource Type Data Source with AverageUtilization
In this case, the calculation of the ratio has changed to the following formula: ratio = metricsTotal * 100 / (requestTotal * spec.metrics[*].resource.target.averageUtilization), where requestTotal is the sum of resource requests for all containers in the pods.
readyMissingPodMetricsCount represents the number of metrics after removing ignoredPods and unreadyPods from all pod metrics.
afterFixMetricsCount represents the number of metrics for pods after data correction.
- Calculate
ratio = metricsTotal * 100 / (requestTotal * spec.metrics[*].resource.target.averageUtilization). - If there are
missingPodsand the ratio is less than 1 (scaling down), correct the monitoring data formissingPodstospec.metrics[*].resource.target.averageUtilization, and includemissingPodsin theafterFixMetricsCount. - If there are
missingPodsand the ratio is greater than or equal to 1 (scaling up or no change), correct the monitoring data formissingPodsto 0, and includemissingPodsin theafterFixMetricsCount. If there areunreadyPods, correct their monitoring data to 0, and includeunreadyPodsin theafterFixMetricsCount. - If there are no
missingPods, and the ratio is greater than1 + tolerance(scaling up) and there areunreadyPods, correct the monitoring data forunreadyPodsto 0, and includemissingPodsin theafterFixMetricsCount. - If there are no
missingPods, and the ratio is within the range[1 - tolerance, 1 + tolerance], no scaling is performed, anddesiredReplicasis set tospec.replicas. - If there are no
missingPods, and the ratio is less than1 - tolerance, scaling down is performed, anddesiredReplicasis calculated asratio * readyPodCountrounded up. - Recalculate the new ratio:
newRatio = afterFixMetricsTotal * 100 / (requestTotal * spec.metrics[*].resource.target.averageUtilization). - If the new ratio is within the range
[1 - tolerance, 1 + tolerance], no scaling is performed, anddesiredReplicasis set tospec.replicas. - If the new ratio is greater than
1 + toleranceand the initial ratio was less than1 - tolerance(scaling down to scaling up), no scaling is performed, anddesiredReplicasis set tospec.replicas. - If the new ratio is less than
1 - toleranceand the initial ratio was greater than1 + tolerance(scaling up to scaling down), no scaling is performed, anddesiredReplicasis set tospec.replicas. - Calculate the new number of replicas:
ceil(afterFixMetricsTotal * newRatio). - If the new ratio is greater than
1 + tolerance, and the initial ratio was also greater than1 + tolerance, and the new number of replicas is less thanspec.replicas, no scaling is performed, anddesiredReplicasis set tospec.replicas. - If the new ratio is less than
1 - tolerance, and the initial ratio was also less than1 - tolerance, and the new number of replicas is greater thanspec.replicas, no scaling is performed, anddesiredReplicasis set tospec.replicas. - In all other cases,
desiredReplicasis set toceil(afterFixMetricsCount * newRatio)rounded up.

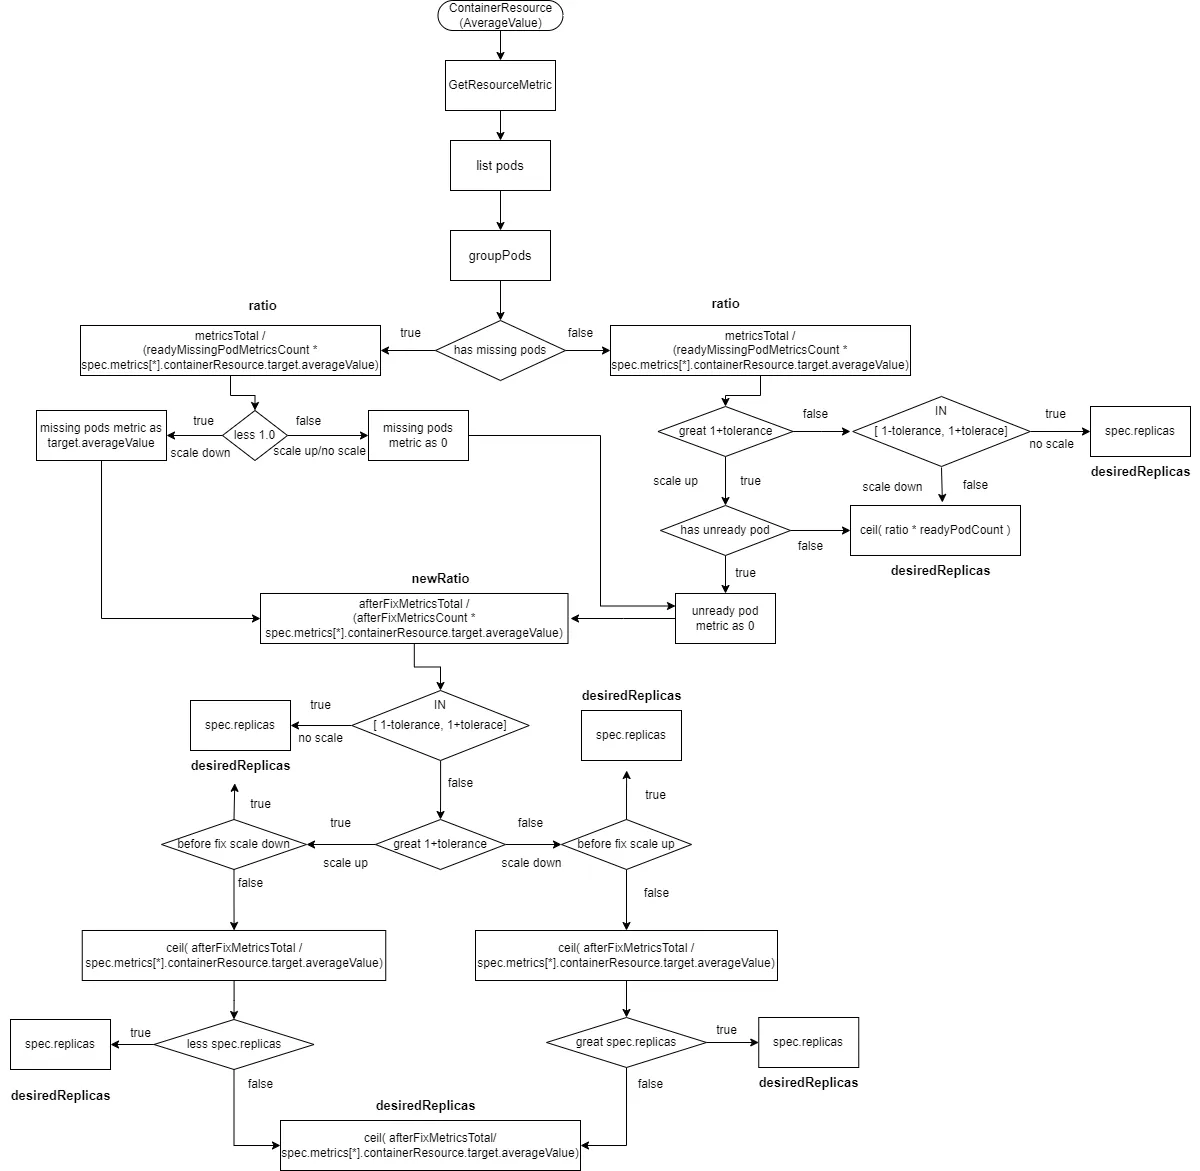
2.2.2.8 ContainerResource Type Data Source with AverageValue
The calculation for ContainerResource type data sources with the type set to AverageValue is similar to the Resource type with AverageValue, with the difference being that metricsTotal is the metrics value for each container (defined in spec.metrics[*].containerResource.container) in pod metrics.
readyMissingPodMetricsCount represents the number of metrics after removing ignoredPods and unreadyPods from all pod metrics.
afterFixMetricsCount represents the number of metrics for pods after data correction.
- Calculate
ratio = metricsTotal / (readyMissingPodMetricsCount * spec.metrics[*].containerResource.target.averageValue). - If there are
missingPodsand the ratio is less than 1 (scaling down), correct the monitoring data formissingPodstospec.metrics[*].containerResource.target.averageValue, and includemissingPodsin theafterFixMetricsCount. - If there are
missingPodsand the ratio is greater than or equal to 1 (scaling up or no change), correct the monitoring data formissingPodsto 0, and includemissingPodsin theafterFixMetricsCount. If there areunreadyPods, correct their monitoring data to 0, and includeunreadyPodsin theafterFixMetricsCount. - If there are no
missingPods, and the ratio is greater than1 + tolerance(scaling up) and there areunreadyPods, correct the monitoring data forunreadyPodsto 0, and includemissingPodsin theafterFixMetricsCount. - If there are no
missingPods, and the ratio is within the range[1 - tolerance, 1 + tolerance], no scaling is performed, anddesiredReplicasis set tospec.replicas. - If there are no
missingPods, and the ratio is less than1 - tolerance, scaling down is performed, anddesiredReplicasis calculated asratio * readyPodCountrounded up. - Recalculate the new ratio:
newRatio = afterFixMetricsTotal / (afterFixMetricsCount * spec.metrics[*].containerResource.target.averageValue). - If the new ratio is within the range
[1 - tolerance, 1 + tolerance], no scaling is performed, anddesiredReplicasis set tospec.replicas. - If the new ratio is greater than
1 + toleranceand the initial ratio was less than1 - tolerance(scaling down to scaling up), no scaling is performed, anddesiredReplicasis set tospec.replicas. - If the new ratio is less than
1 - toleranceand the initial ratio was greater than1 + tolerance(scaling up to scaling down), no scaling is performed, anddesiredReplicasis set tospec.replicas. - Calculate the new number of replicas:
ceil(afterFixMetricsTotal / spec.metrics[*].containerResource.target.averageValue). - If the new ratio is greater than
1 + tolerance, and the initial ratio was also greater than1 + tolerance, and the new number of replicas is less thanspec.replicas, no scaling is performed, anddesiredReplicasis set tospec.replicas. - If the new ratio is less than
1 - tolerance, and the initial ratio was also less than1 - tolerance, and the new number of replicas is greater thanspec.replicas, no scaling is performed, anddesiredReplicasis set tospec.replicas. - In all other cases,
desiredReplicasis set toceil(afterFixMetricsCount * newRatio)rounded up.
2.2.2.9 ContainerResource Type Data Source with AverageUtilization
The calculation process for ContainerResource type data sources with the type set to AverageUtilization is similar to the Resource type with AverageUtilization.
Here, totalRequest represents the resource requests of containers in pods (defined in spec.metrics[*].containerResource.container).
readyMissingPodMetricsCount represents the number of metrics after removing ignoredPods and unreadyPods from all pod metrics.
afterFixMetricsCount represents the number of metrics for pods after data correction.
- Calculate
ratio = metricsTotal * 100 / (requestTotal * spec.metrics[*].containerResource.target.averageUtilization). - If there are
missingPodsand the ratio is less than 1 (scaling down), correct the monitoring data formissingPodstospec.metrics[*].containerResource.target.averageUtilization, and includemissingPodsin theafterFixMetricsCount. - If there are
missingPodsand the ratio is greater than or equal to 1 (scaling up or no change), correct the monitoring data formissingPodsto 0, and includemissingPodsin theafterFixMetricsCount. If there areunreadyPods, correct their monitoring data to 0, and includeunreadyPodsin theafterFixMetricsCount. - If there are no
missingPods, and the ratio is greater than1 + tolerance(scaling up) and there areunreadyPods, correct the monitoring data forunreadyPodsto 0, and includemissingPodsin theafterFixMetricsCount. - If there are no
missingPods, and the ratio is within the range[1 - tolerance, 1 + tolerance], no scaling is performed, anddesiredReplicasis set tospec.replicas. - If there are no
missingPods, and the ratio is less than1 - tolerance, scaling down is performed, anddesiredReplicasis calculated asratio * readyPodCountrounded up. - Recalculate the new ratio:
newRatio = afterFixMetricsTotal * 100 / (requestTotal * spec.metrics[*].containerResource.target.averageUtilization). - If the new ratio is within the range
[1 - tolerance, 1 + tolerance], no scaling is performed, anddesiredReplicasis set tospec.replicas. - If the new ratio is greater than
1 + toleranceand the initial ratio was less than1 - tolerance(scaling down to scaling up), no scaling is performed, anddesiredReplicasis set tospec.replicas. - If the new ratio is less than
1 - toleranceand the initial ratio was greater than1 + tolerance(scaling up to scaling down), no scaling is performed, anddesiredReplicasis set tospec.replicas. - Calculate the new number of replicas:
ceil(afterFixMetricsTotal * newRatio). - If the new ratio is greater than
1 + tolerance, and the initial ratio was also greater than1 + tolerance, and the new number of replicas is less thanspec.replicas, no scaling is performed, anddesiredReplicasis set tospec.replicas. - If the new ratio is less than
1 - tolerance, and the initial ratio was also less than1 - tolerance, and the new number of replicas is greater thanspec.replicas, no scaling is performed, anddesiredReplicasis set tospec.replicas. - In all other cases,
desiredReplicasis set toceil(afterFixMetricsCount * newRatio)rounded up.
2.3 Scaling Behavior Control Policies
Once the previous process is completed, you obtain an expected number of replicas. However, this number is not the final number calculated by the HPA controller. It needs to go through scaling behavior control policies to determine the ultimate number of replicas.
Scaling behavior policies control the speed of scaling to prevent rapid and unstable scaling.
Scaling behavior control is divided into two types: when spec.behavior is not set in the HPA object (default scaling behavior) and when spec.behavior is set.
2.3.1 Default Scaling Behavior (When spec.behavior is not set)
downscaleStabilisationWindow: Value is set to --horizontal-pod-autoscaler-downscale-stabilization, which is 5 minutes by default.
- Record the number of replicas calculated by the previous process and the time it was executed in memory.
- Find the maximum number of replicas in the
downscaleStabilisationWindowwindow from memory, denoted asstabilizedRecommendation. - The maximum scaling limit within this window,
scaleUpLimit, is calculated asmax(2*spec.replicas, 4). - Normalize the
stabilizedRecommendation(cap it at the upper limit if greater, or set it to the lower limit if less) to obtain the final number of replicas. The upper limit ismin(scaleUpLimit, hpa.Spec.MaxReplicas), and the lower limit isminReplicas(defaulting tohpa.Spec.minReplicasor 1 if not set), ensuring that the desired number of replicas falls within[minReplicas, min(max(2*spec.replicas, 4), hpa.Spec.maxReplicas)].
2.3.2 When spec.behavior is set
Every time the HPA controller scales, it records the change in the number of replicas for the corresponding workload and the scaling time in memory.
Record the
desiredReplicasand execution time from the previous process in memory.Find the minimum number of replicas,
upRecommendation, from thehpa.spec.behavior.scaleUp.stabilizationWindowSecondswindow (includingdesiredReplicas).Find the maximum number of replicas,
downRecommendation, from thehpa.spec.behavior.scaleDown.stabilizationWindowSecondswindow (includingdesiredReplicas).Normalize the
spec.replicasto obtain the stabilized window’s number of replicas,stabilizedRecommendation.If
spec.replicasis greater thandownRecommendation, thenstabilizedRecommendationis set todownRecommendation.If
spec.replicasis less thanupRecommendation, thenstabilizedRecommendationis set toupRecommendation.In summary,
stabilizedRecommendationis within the range[upRecommendation, downRecommendation], and scale up is only possible ifspec.replicasis less than the minimum value in thehpa.spec.behavior.scaleUp.stabilizationWindowSecondswindow, scale down is only possible ifspec.replicasgreater than the maximum value in thehpa.spec.behavior.scaleDown.stabilizationWindowSecondswindow.
In the case of scaling up (
stabilizedRecommendationis greater thanspec.replicas):If
hpa.spec.behavior.scaleUp.selectPolicyis set to Disabled, no scaling is performed, and the final number of replicas is set tospec.replicas.If
hpa.spec.behavior.scaleUp.selectPolicyis set to Max, the following steps are performed for each policy inhpa.spec.behavior.scaleUp.policies:Find the cumulative change in the number of replicas,
replicasAddedInCurrentPeriod, within thepolicy.periodSecondspolicy window. The number of replicas at the start of the window isperiodStartReplicas = spec.replicas - replicasAddedInCurrentPeriod.If the policy type
policy.Typeis “Pods,” the upper limit for the policy window ispolicyLimit = periodStartReplicas + policy.Value.If the policy type
policy.Typeis “Percent,” the upper limit for the policy window ispolicyLimit = Ceil(periodStartReplicas * (1 + policy.Value/100)), rounded up.The maximum scaling limit within this window,
scaleUpLimit, is the maximum of all the policy window upper limits:scaleUpLimit = max(policyLimit1, policyLimit2, ...).
If
hpa.spec.behavior.scaleUp.selectPolicyis set to Min, the following steps are performed for each policy inhpa.spec.behavior.scaleUp.policies:Find the cumulative change in the number of replicas,
replicasAddedInCurrentPeriod, within thepolicy.periodSecondspolicy window. The number of replicas at the start of the window isperiodStartReplicas = spec.replicas - replicasAddedInCurrentPeriod.If the policy type
policy.Typeis “Pods,” the upper limit for the policy window ispolicyLimit = periodStartReplicas + policy.Value.If the policy type
policy.Typeis “Percent,” the upper limit for the policy window ispolicyLimit = Ceil(periodStartReplicas * (1 - policy.Value/100)), rounded up.The maximum scaling limit within this window,
scaleUpLimit, is the minimum of all the policy window upper limits:scaleUpLimit = min(policyLimit1, policyLimit2, ...).
The final number of replicas is calculated as
min(stabilizedRecommendation, min(scaleUpLimit, hpa.Spec.maxReplicas)).
In the case of scaling down (
stabilizedRecommendationis greater thanspec.replicas):If
hpa.spec.behavior.scaleDown.selectPolicyis set to Disabled, no scaling is performed, and the final number of replicas is set tospec.replicas.If
hpa.spec.behavior.scaleDown.selectPolicyis set to Max, the following steps are performed for each policy inhpa.spec.behavior.scaleDown.policies:Find the cumulative change in the number of replicas,
replicasAddedInCurrentPeriod, within thepolicy.periodSecondspolicy window. The number of replicas at the start of the window isperiodStartReplicas = spec.replicas + replicasAddedInCurrentPeriod.If the policy type
policy.Typeis “Pods,” the lower limit for the policy window ispolicyLimit = periodStartReplicas - policy.Value.If the policy type
policy.Typeis “Percent,” the lower limit for the policy window ispolicyLimit = Ceil(periodStartReplicas * (1 - policy.Value/100)), rounded up.The maximum scaling limit within this window,
scaleUpLimit, is the maximum of all the policy window lower limits:scaleUpLimit = max(policyLimit1, policyLimit2, ...).
If
hpa.spec.behavior.scaleDown.selectPolicyis set to Min, the following steps are performed for each policy inhpa.spec.behavior.scaleDown.policies:Find the cumulative change in the number of replicas,
replicasAddedInCurrentPeriod, within thepolicy.periodSecondspolicy window. The number of replicas at the start of the window isperiodStartReplicas = spec.replicas + replicasAddedInCurrentPeriod.If the policy type
policy.Typeis “Pods,” the lower limit for the policy window ispolicyLimit = periodStartReplicas - policy.Value.If the policy type
policy.Typeis “Percent,” the lower limit for the policy window ispolicyLimit = Ceil(periodStartReplicas * (1 - policy.Value/100)), rounded up.The maximum scaling limit within this window,
scaleUpLimit, is the minimum of all the policy window lower limits:scaleUpLimit = min(policyLimit1, policyLimit2, ...).
The final number of replicas is calculated as
max(stabilizedRecommendation, max(scaleUpLimit, hpa.Spec.maxReplicas)).
2.4 Reasons for Slow Scaling
Slow scaling involves two aspects: response time and the number of replicas per scaling, i.e., the scaling speed.
Slow scaling involves three aspects: response time, the number of replicas added during each scaling event (scaling speed), and the sensitivity of the scaling process.
2.4.1 Response Time for Scaling
Due to the periodic collection of monitoring information by the metrics-server on kubelet, with default cycles of 15s, and the cadvisor within kubelet, with a cycle of 30s, the HPA controller calculates the workload replicas every 15 seconds.
For resource and containerResource data source types, the scaling delay ranges from 0 to 60s, with a maximum delay of 60s.
For other scaling types, the delay is influenced by the monitoring components (e.g., Prometheus, VictoriaMetrics) and ranges from 0 to 15 + monitoring collection cycle.
2.4.2 Scaling Speed
Understanding the HPA controller’s replica calculation process, the final number of replicas is determined by monitoring data and scaling behavior control. Analyzing the initial test results, let’s examine the status field when there’s a change in HPA resources for the first time after the load test begins. Here, the monitoring shows averageUtilization as 2575 and averageValue as 515m.
Based on this data, the expected number of replicas is 258 = ceil(spec.replicas * averageValue * 100 / request * target.averageUtilization) = ceil(2 * 515 * 100/20 * 20).
As hpa.spec.maxReplicas is 10, this value is stored in memory. Since hpa.spec.behavior is not configured, the scaling upper limit for this window is 4 = max(2 * spec.replicas, 4) = max(4, 4). Therefore, the final number of replicas for the first time is 4.
status:
  conditions:
  - lastTransitionTime: "2023-11-02T03:27:06Z"
    message: the HPA controller was able to update the target scale to 4
    reason: SucceededRescale
    status: "True"
    type: AbleToScale
  - lastTransitionTime: "2023-11-02T03:37:07Z"
    message: the HPA was able to successfully calculate a replica count from cpu resource
      utilization (percentage of request)
    reason: ValidMetricFound
    status: "True"
    type: ScalingActive
  - lastTransitionTime: "2023-11-02T05:01:38Z"
    message: the desired replica count is increasing faster than the maximum scale
      rate
    reason: ScaleUpLimit
    status: "True"
    type: ScalingLimited
  currentMetrics:
  - resource:
      current:
        averageUtilization: 2575
        averageValue: 515m
      name: cpu
    type: Resource
  currentReplicas: 2
  desiredReplicas: 4
  lastScaleTime: "2023-11-02T05:10:26Z"
The second time the HPA resources change, the monitoring data in the status field, averageUtilization and averageValue, are both 0. Since the minimum number of replicas is 1 (as hpa.spec.minReplicas is not configured, defaulting to 0), the expected number of replicas is 1, and it is stored in memory. Since the maximum number of replicas in memory for this window is 10, scaling is still performed. Therefore, the final number of replicas is 8 = max(2 * spec.replicas, 4) = max(8, 4). Subsequent scaling is similar, and we won’t analyze it here.
status:
  conditions:
  - lastTransitionTime: "2023-11-02T03:27:06Z"
    message: the HPA controller was able to update the target scale to 8
    reason: SucceededRescale
    status: "True"
    type: AbleToScale
  - lastTransitionTime: "2023-11-02T03:37:07Z"
    message: the HPA was able to successfully calculate a replica count from cpu resource
      utilization (percentage of request)
    reason: ValidMetricFound
    status: "True"
    type: ScalingActive
  - lastTransitionTime: "2023-11-02T05:01:38Z"
    message: the desired replica count is increasing faster than the maximum scale
      rate
    reason: ScaleUpLimit
    status: "True"
    type: ScalingLimited
  currentMetrics:
  - resource:
      current:
        averageUtilization: 0
        averageValue: "0"
      name: cpu
    type: Resource
  currentReplicas: 4
  desiredReplicas: 8
  lastScaleTime: "2023-11-02T05:10:41Z"
2.4.3 Sensitivity of Scaling
Due to the --horizontal-pod-autoscaler-tolerance parameter, which controls the acceptable range of fluctuations during scaling, it is designed to prevent unexpected scaling behaviors caused by jitter in monitoring data. However, it also reduces the sensitivity of the scaling process. The default value is 0.1, meaning it can tolerate a 10% change in monitoring data.
For example, in the scenario above, scaling would only occur when the average CPU utilization of pods reaches 22% of the request.
2.4.4 HPA Controller Efficiency
In version 1.23, the HPA controller runs only one goroutine to handle all HPA resources in the cluster, creating a performance bottleneck in clusters with numerous HPA objects. Therefore, in version 1.26, the --concurrent-horizontal-pod-autoscaler-syncs command-line option is introduced to configure the number of goroutines PR#108501.
2.4.5 Application Ready Time
Due to the existence of unready pod monitoring data repair issues (where data is fixed to 0 during scaling), the scaling speed can be slowed.
The shorter the time needed for pod readiness, the faster the scaling. The time from pod startup to readiness depends on pod scheduling, kubelet response to completed pod scheduling, image downloading, container creation, application startup, and application readiness.
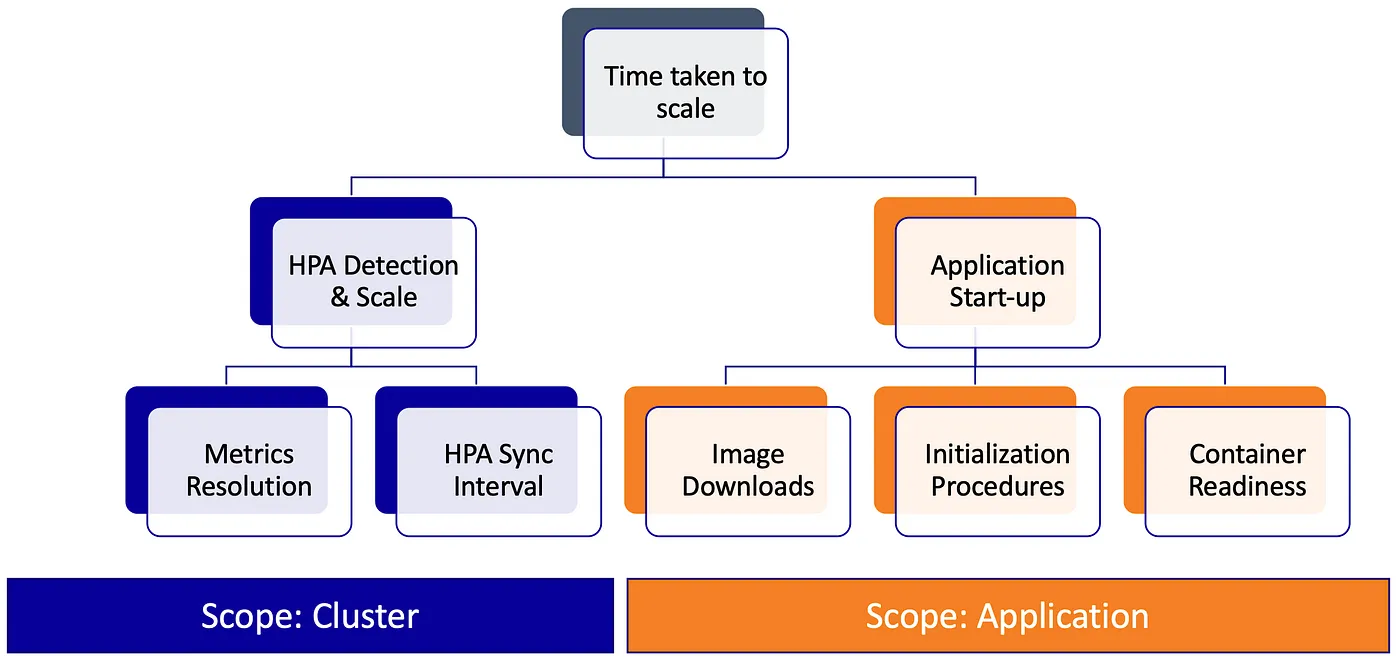
Image Source: medium.com/expedia-group-tech
3 Solutions
3.1 Approach to Resolution
Shorten the Monitoring Chain Length
- Simplify the monitoring chain length to reduce the response time for scaling.
- Projects like Knative and KEDA also handle horizontal scaling. Knative simplifies the monitoring chain to address scaling response time issues, supporting QPS and TPS-based scaling for near-instant elasticity.
- While KEDA replaces Prometheus-adaptor and provides external and custom metrics, it maintains HPA mechanisms and addresses the sensitivity of event-driven scaling (knative also support).
Shorten Pod Ready Time
- Optimize various aspects from image acceleration (Dragonfly P2P, pre-pulling, Containerd Nydus) to container runtimes (crun, Podman, CRI-O), scheduler performance, and topology awareness.
HPA Controller Performance Improvement
- Enhance the performance of the HPA controller by utilizing versions 1.26 and above, which support multiple goroutines. Use sufficient resources to run kube-controller-manager.
Predictive Scaling or Scheduled Scaling
- Adopt a different approach by considering predictive scaling or scheduled scaling.
- Solutions like AHPA by Alibaba Cloud and Kapacity by Ant Financial offer proactive scaling strategies.
- Historical traffic-based predictive scaling can be implemented with tools such as Crane’s EHPA, Kapacity by Ant Financial, and AHPA by Alibaba Cloud.
Configuring Sensible Scaling Behavior Policies
If the
behaviorfield is not set, the scaling quantity during each scaling operation is constrained by the maximum replicas within thedownscaleStabilisationWindowwindow and the current replica countspec.replicas(the maximum scaling limitscaleUpLimitismax(2*spec.replicas, 4)).Therefore, without setting the
behaviorfield, it’s essentially impossible to increase the scaling speed. This is becausedownscaleStabilisationWindowdetermines the duration of the window with the maximum replicas, and its purpose is to prevent unstable replica counts caused by sudden increases followed by decreases, whilespec.replicasremains fixed during the tuning cycle of the HPA object.Since the configuration of the
behaviorfield affects scaling, a reasonable configuration of thebehaviorfield can improve scaling speed.- Increase Scaling Speed: Decrease
hpa.spec.behavior.scaleUp.stabilizationWindowSeconds(default is 0 if not set) and increasehpa.spec.behavior.scaleUp.policies[*].Value, and decreasehpa.spec.behavior.scaleUp.policies[*].PeriodSeconds. - Increase Shrinking Speed: Decrease
hpa.spec.behavior.scaleDown.stabilizationWindowSeconds(default is the value of--horizontal-pod-autoscaler-downscale-stabilizationif not set) and increasehpa.spec.behavior.scaleDown.policies[*].Value, and decreasehpa.spec.behavior.scaleDown.policies[*].PeriodSeconds.
- Increase Scaling Speed: Decrease
Configuring Sensible Tolerance
Set a reasonable value for
--horizontal-pod-autoscaler-tolerance. It is a double-edged sword; if not adjusted properly, it can lead to frequent scaling behaviors.
4 Conclusion
The delays in scaling caused by the lengthy monitoring data acquisition chain and HPA controller performance issues can be addressed by optimizing pod ready time and considering proactive scaling strategies. The duration of application readiness and the impact of hpa.spec.behavior also play crucial roles in scaling speed.
To achieve faster pod ready times, optimization efforts should be directed at each stage from pod creation to pod readiness. Different projects, such as Knative, Crane’s EHPA, and Kapacity, offer diverse solutions to tackle these challenges.
5 Reference
Autoscaling in Kubernetes: Why doesn’t the Horizontal Pod Autoscaler work for me?